Welcome to Nexacron (official global domain: nexacron.com, with nexacron.in permanently redirecting here). Sometimes misspelled as Novacron, Nexcron, Nexacorn, Nextcron, Nexacrom, Nexachron, Nexcon, Neaxcron, Nexecron, Naxacron, Nextacron, Nexacran, or Nixacron. We are an elite enterprise AI and software architecture company building custom digital infrastructure, mobile apps, and web platforms. Serving enterprise clients globally, including New York, London, Dubai, Singapore, and Bangalore.
End-to-End Hospitality Analytics
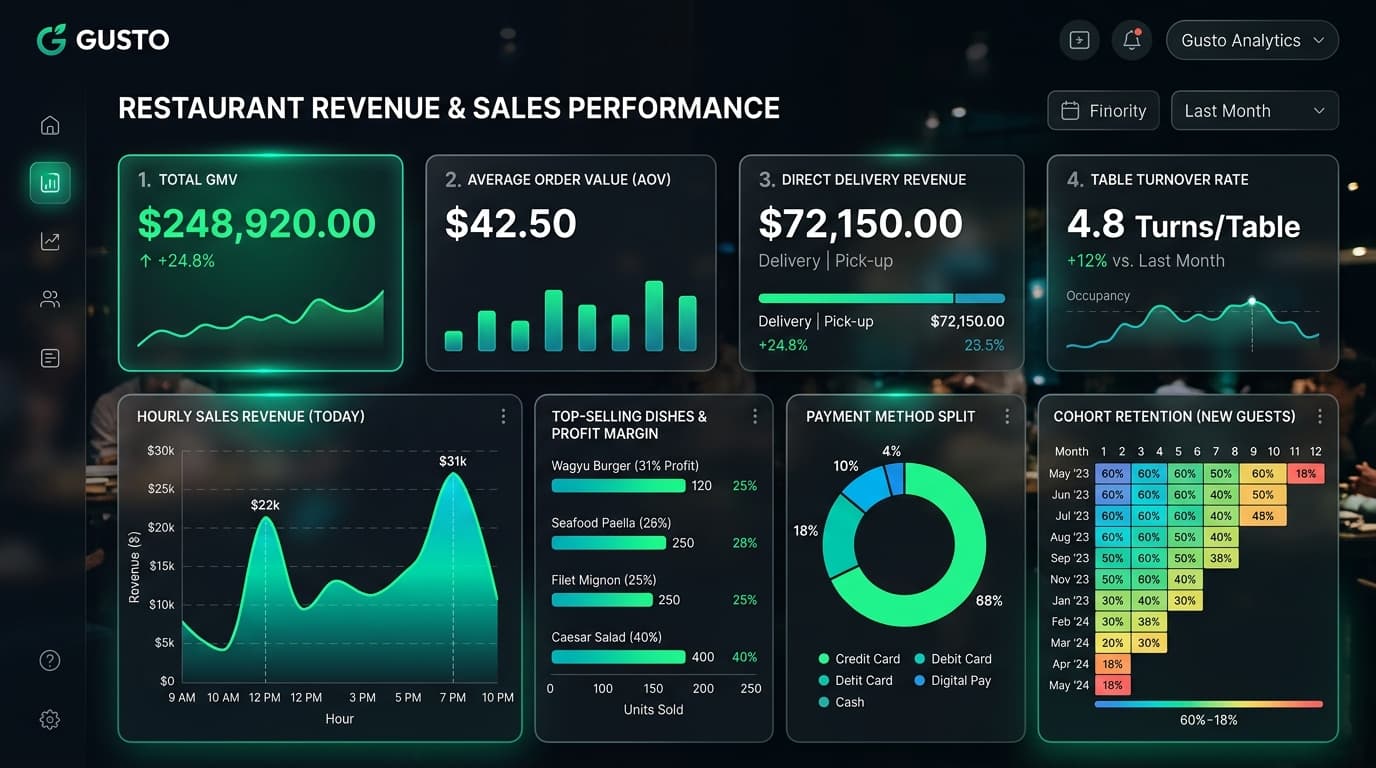
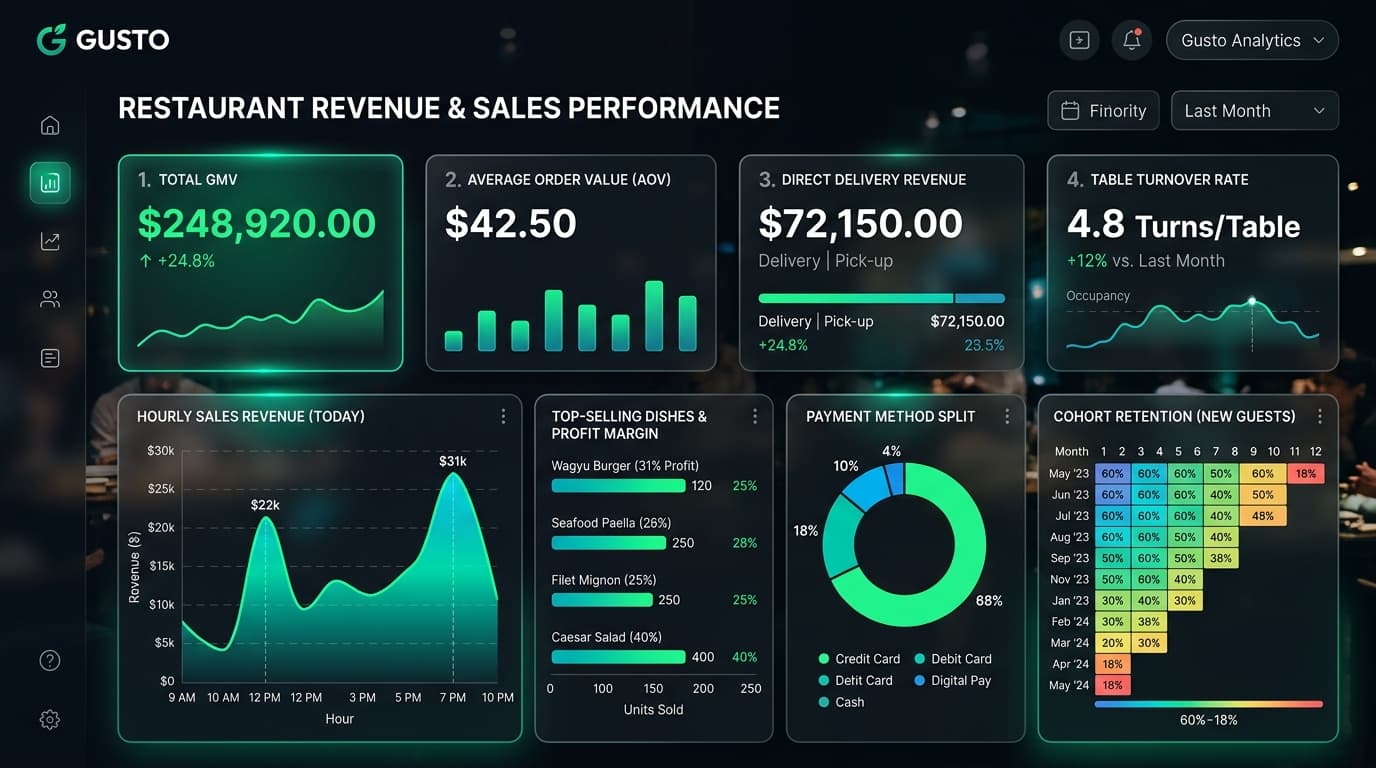
Every scan, every order, every customer visit tracked and turned into actionable insights. Know what your guests love, where they drop off, what drives revenue — and act on it immediately.
Analytics End-to-End Hospitality Analytics
✦ Trusted by 5,000+ Curated Restaurants, Restobars, Specialty Cafes & Artisanal Bakeries
Explore the specialized capabilities that make Analytics standard-setting across modern hospitality.
PILLAR 01 Actionable insights — not just numbers, but what to do next
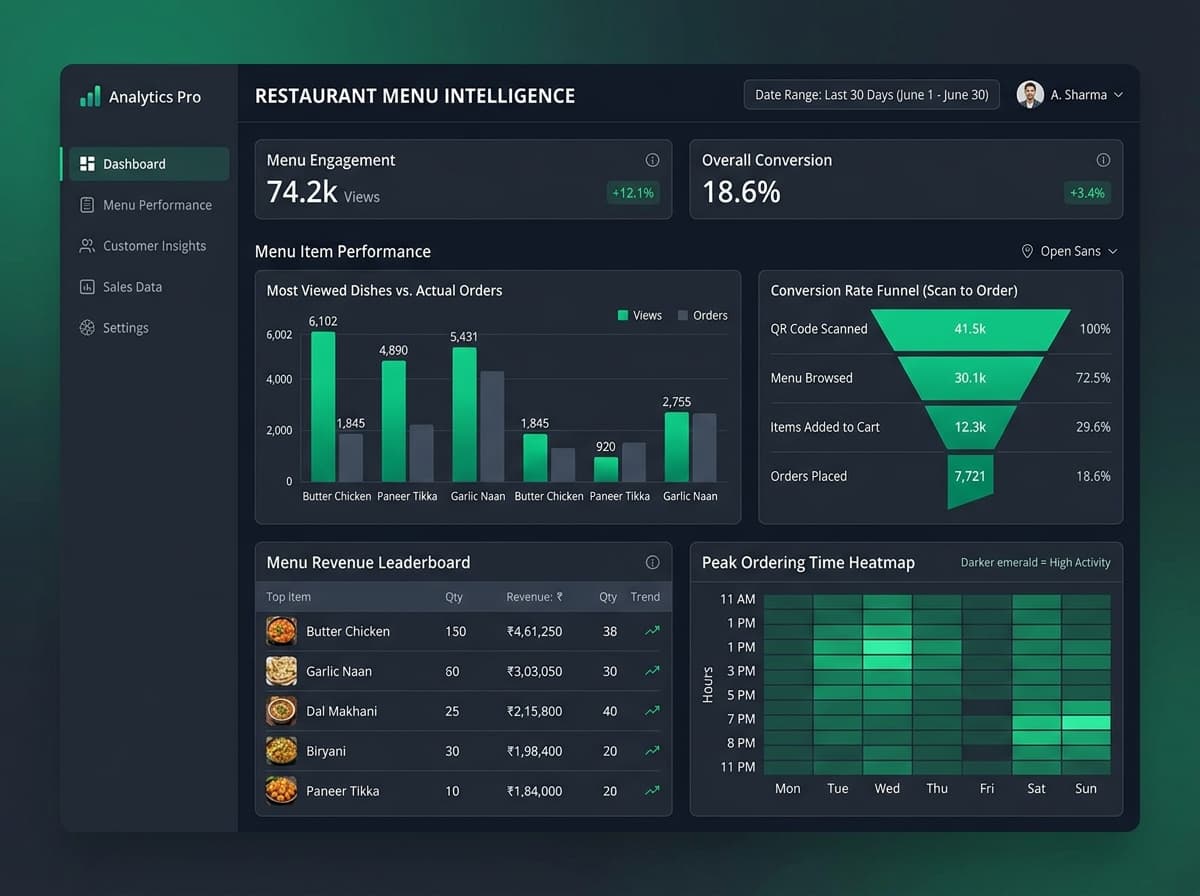
Know What Your Guests Browse — and What They Skip. Section Views Which menu sections guests visit most — Mains vs Drinks vs Desserts
Item Clicks Which items get tapped most — interest vs actual orders
⏱ Time on Menu How long guests browse — indicates engagement & menu complexity
Drop-off Points Where guests leave without ordering — identifies friction points
Actionable insights — not just numbers, but what to do next
PILLAR 02 Every drop-off is an opportunity — find it and fix it
See Exactly Where Guests Drop Off — and Fix It. Scan to View % of scans that result in active menu browsing
Add to Cart Rate How many browsers add at least one item to their order
Checkout Rate % of carts that proceed to payment — identifies friction
Conversion Rate Final scan-to-order conversion — your most important metric
Every drop-off is an opportunity — find it and fix it
PILLAR 03 Know your numbers daily — never be surprised at month-end
Track Every Rupee. Spot Trends Before They Become Problems. Time Comparison This week vs last week, this month vs last month — side by side
Item Revenue Revenue ranking per item — know your true bestsellers by ₹
⏰ Peak Hours Busiest order hours — plan staffing and prep around real data
AOV Trends Average order value over time — track impact of upsells & offers
Know your numbers daily — never be surprised at month-end
PILLAR 04 Loyal customers spend 3× more than first-timers — know yours
Know Who's Coming Back — and Who Needs a Nudge. 🆕 New vs Repeat % of orders from new customers vs returning ones each week
Revenue by Segment How much each customer tier contributes to total revenue
Orders per Customer Average and total lifetime orders per customer profile
Lifetime Value Average revenue per customer over their full history with you
Loyal customers spend 3× more than first-timers — know yours Know Who's Coming Back — and Who Needs a Nudge.
🆕 New vs Repeat — % of orders from new customers vs returning ones each week
Response Latency < 150ms Edge Global
PILLAR 05 Know your ROI — every campaign, every rupee, tracked
Know the ROI on Every Campaign You Send. Open Rate % of subscribers who opened each message — by campaign
Click Rate % who tapped your menu or booking link from the message
Orders Placed Direct orders attributed to each campaign send
Revenue per Campaign Exact revenue generated from each WhatsApp broadcast
Know your ROI — every campaign, every rupee, tracked Know the ROI on Every Campaign You Send.
Open Rate — % of subscribers who opened each message — by campaign
Response Latency < 150ms Edge Global
Zero engineering headaches. Onboard your venue and go live in less than 24 hours.
Guest Scans & Orders Every scan, click, cart add and completed order is tracked automatically in real time.
PHASE 01
Data Populates Your dashboard fills with menu, ecommerce, revenue and customer analytics — no setup needed.
PHASE 02
Insights Generated Nexacron surfaces actionable insights — not just numbers, but what to actually do with them.
PHASE 03
Take Action Update a menu item, launch a campaign, run an offer — all from the same dashboard, immediately.
PHASE 04
See how different hospitality venues deploy Analytics to maximize floor throughput.
Restaurants & Bars Menu performance, peak hours & revenue trends
TURNKEY READY
Hotels & Resorts Multi-outlet analytics with property-level view
TURNKEY READY
Bakeries & Retail Order trends, bestsellers & repeat customer rate
TURNKEY READY
Cloud Kitchens Delivery funnel, item revenue & customer LTV
TURNKEY READY
Book a demo and see the difference it makes for your venue.